Quantitative market intelligencePrivate beta · paper only
move across the field to read a dayreading the history, day by day
Artistic interpretation of real data — BTC/USDT daily candles, Apr 2024 to 12 Nov 2026 (Binance public). Across: time. Depth: volatility window, 3 to 120 days. Height: realised volatility, measured with past returns only. Glow: unusual daily moves. The scattered cloud after the last close in the dataset is the ±σ√t volatility method, not a forecast.
Market intelligence, risk analysis and paper trading for crypto. Market Analyst and Radar are in beta. Paper trading only, no real money.
01The trajectory, read precisely · BTC/USDT daily
12 Nov 2026 · latest in dataset
$71,460
- Trend
- mixed
- Volatility
- 3.2% daily
- Move
- 1.8σ — ordinary
The same candles, drawn exactly.
Scrub any day, switch the lens — trend regime, volatility, unusual moves. The cone at the end is the volatility method, not a prediction.
- 12 Nov 2026 · latest in dataset
- $71,460
- Trend
- mixed
Real BTC/USDT daily closes, Binance public data, Jan 2024 – 12 Nov 2026. Lenses computed in your browser. Cone: ±1σ/±2σ from trailing 30-day realised volatility (1.9%/day), √t scaling, zero drift — it illustrates the method, not a prediction. Lower track: EMA 50 / 200 alignment.
02The market as data
Before any model has an opinion, the market is a set of aligned measurements. Four are computed below from real BTC/USDT candles, in your browser. Two are not connected yet — so they are shown empty, not simulated.
$71,460
−3.45% on the day
1.1× its 20-day average
3.2% per day · 1.0× median
no clear trend since 5 Nov
not connected yet
not connected yet
UTC days
How to read this
Every layer shares one clock. Move the cursor and each row reports what it measured at that exact bar. Select a layer to see what it adds — and what is still missing.
BTC/USDT · Binance public spot candles · 13 Nov 2025 – 12 Nov 2026 · indicators computed on the full history before the window, so the first bar shown is not a warm-up artefact.
Data is not intelligence.
A price is an observation. It becomes useful only when a hypothesis is stated in advance, tested on data it has never seen, and kept honest by its own track record.
03Intelligence waves
Many models. One honest picture of what they say — and don’t.
The last 168 closed hourly BTC/USDT bars of the shadow replay. Every lane is a different kind of model, drawn in its own form. Rule strategies only speak when their rules fire, so most of the time they abstain. Models that produce nothing yet are shown empty, with the reason.
- Bars where the lanes that are on disagree
- 70 of 168 · mean split 42%
- Strategy calls resolved in the shadow replay
- 2 / 28 correct · 95% CI 2%–23%
- What this is
- A research record, not a signal service. No model here has a validated edge yet; samples are far too small to conclude anything.
04One decision, start to finish
Follow one decision recorded on 21 Oct 2026: the data it saw, the signals it read, the call it made, what the risk engine allowed, and what actually happened. Replayed exactly as logged — paper only.
01 / 05
Market observation
Every decision starts with raw, closed candles. Here: the 72 hourly BTC/USDT bars the model could see at 21 Oct 2026, 13:00 UTC. Nothing after that moment exists for it yet.
- Source
- Binance public spot candles
- Window
- 72 × 1h, price + volume
- Last close
- 83,826 USDT
02 / 05
Signal detection
The breakout lens compared the last close with the prior 20 hours. In plain words, it saw:
- The close broke above the highest high of the prior 20 hours
- The bar closed near the top of its range
- Volume was well above its recent average
- Volatility sat inside the normal band
“Close 83826.01 broke the prior 20-bar high 83713.91 (+0.10% buffer) with volume 2.53× average and ATR 0.44% of price.”
Inputs:price & volume · historical candlesnews · plannedsentiment · plannedmacro · planned
03 / 05
Model evaluation
The model calls up over the next 4 hours. It is recorded in shadow mode, timestamped before the outcome exists. A hypothesis, not a promise.
- Model
- breakout · v1.0.0
- Call
- UP · 4-hour horizon
- Mode
- shadow — recorded, not traded
04 / 05
Risk decision
A separate engine, not the model, decides whether a paper position may exist and how large. Verdict: approved — inside every limit; size capped by the per-position allocation.
- Sized notional
- 39.42 USDT
- Amount at risk
- 0.48 USDT
- Est. costs
- 0.08 USDT
- Stop
- 83,082 USDT
- Portfolio
- simulated 200 USDT paper portfolio, default limits
05 / 05
Simulated outcome
Only now are the next hours revealed. Over 4 hours price rose +1.02%; after estimated costs the paper result was +0.70%. This call was right.
In this replay window 2 of 28 resolved calls were right (95% interval 2–23%). One episode proves nothing — every call is scored, including the misses.
Every forecast is a hypothesis.
2 / 28
strategy calls correct in the shadow replay · 95% interval 2%–23%. Far too few to conclude anything — so nothing is promoted, and nothing is promised.
04Historical market replay
BTC/USDT, breakout, 21 Oct 2026 · 13:00 UTC. Step 1 of 6: Market state.
01 · Market state
BTC/USDT at 13:00 UTC, 21 Oct 2026
83,826
close of the decision hour
- Last 24 hours
- +2.04%
- Volatility (ATR 14)
- 0.45% of price
- Trend (EMA 20 / 50)
- stacked up
- 72h range
- 80,684–83,969
02 · Information available
Information available at that timestamp
Only the past.
- 72 closed hourly candlesto 13:00 UTC
- Volume per candleBinance public spot
- Derived featuresATR, channels, EMAs, RSI, ADX
- News and sentimentnot connected yet
- Social attention, macronot connected yet
- The next 5 hoursunknowable — locked
03 · Signal generated
Breakout model v1.0.0 · as logged
↑Upover the next 4 hours
Close 83826.01 broke the prior 20-bar high 83713.91 (+0.10% buffer) with volume 2.53× average and ATR 0.44% of price.
- Close above channel
- Strong close
- Volume confirmed
- Volatility in band
04 · Independent risk decision
Independent risk engine · it never sees the future either
Approved
Inside every limit — size capped by the per-position allocation.
- Sized position
- 39.42 USDT
- At risk if stopped
- 0.48 USDT
- Stop
- 83,082 (−0.89%)
- Estimated fees
- 0.08 USDT
05 · Simulated order or no trade
Simulated order
Paper long
0.00047 BTC at ≈83,826
Opened on a simulated 200 USDT paper portfolio, default limits. Paper only — no order reached an exchange. The shaded band is what the position could lose before the stop.
06 · Actual outcome, after the fact
Keep scrolling to unlock the next 4 hours — after every decision has been made.
2 of 28
resolved calls were right across the replay window — no edge yet.
One right call and one wrong call are shown above because both happen. The scorecard is the whole window, not the highlights.
local shadow replay, last 400 hourly bars per market · BTC/USDT, ETH/USDT, SOL/USDT
Opportunity discovery
local shadow replay, last 400 hourly bars per market
3
Markets scanned
BTC · ETH · SOL
3,600
Model evaluations
every model, every bar
28
Directional calls
the rest said “no call”
28
Resolved
scored at the horizon
0
Passing the bar
≥100 calls, above baseline, after costs
- Bar lengths on a log scale.
Ranked by what the evidence can support.
Each model × market, ordered by the low end of its 95% interval. To pass, a candidate needs at least 100 resolved calls, an interval wholly above the best baseline for that market, and a positive average after costs.
- Baseline · BTC
- 21.5% always up
- Baseline · ETH
- 33.3% momentum 24
- Baseline · SOL
- 32.0% momentum 24
- Cost hurdle
- 0.32% round trip
● hit rate━ 95% interval (0–100%)| baseline
- 01
Breakout
BTC/USDT · 1h
1/3 right
−0.34% avg net per call
Too few calls (3 of 100 needed)
- 02
Breakout
ETH/USDT · 1h
1/5 right
−0.73% avg net per call
Too few calls (5 of 100 needed)
- 03
Breakout
SOL/USDT · 1h
0/8 right
−0.97% avg net per call
Too few calls (8 of 100 needed)
- 04
Mean reversion
ETH/USDT · 1h
0/3 right
−0.62% avg net per call
Too few calls (3 of 100 needed)
- 05
Mean reversion
BTC/USDT · 1h
0/2 right
−0.35% avg net per call
Too few calls (2 of 100 needed)
- 06
Mean reversion
SOL/USDT · 1h
0/2 right
−0.18% avg net per call
Too few calls (2 of 100 needed)
- 07
Trend following
BTC/USDT · 1h
0/2 right
−1.22% avg net per call
Too few calls (2 of 100 needed)
- 08
Trend following
SOL/USDT · 1h
0/2 right
−1.37% avg net per call
Too few calls (2 of 100 needed)
- 09
Trend following
ETH/USDT · 1h
0/1 right
−1.15% avg net per call
Too few calls (1 of 100 needed)
Avg net = mean return per resolved call after fees (0.10% per side), slippage and spread.
Nothing is ready to act on yet — and the hunter says so.
No candidate has enough calls to separate skill from luck. The scan keeps running in shadow mode; nothing graduates until the numbers do.
05The platform
From one chart to the whole workspace.
The real terminal, captured from a local build replaying real historical market data. Scroll and it assembles panel by panel: market data, forecasts, risk, research.
- 01Market data
Closed candles from public exchange data, drawn with the shadow forecasts and unusual moves.
- 02Forecasts
Every model's call on the latest bar, its track record with a 95% interval, and when it abstains.
- 03Risk intelligence
Regime and drift, and the paper portfolio against its hard limits — before any simulated order.
- 04Research context
Watchlist, opportunities ranked by the lower bound of their interval, model performance, co-movement.
- 05The terminal
One workspace. Paper only — every balance, order and result is simulated.
—Inside the terminal
Seven areas of the working product. Pick one; the numbered points explain what you are looking at in plain words. Every screen is a capture of the real build replaying historical market data.
The market comes first: what it did, how fresh the data is, and an honest verdict before any model output.
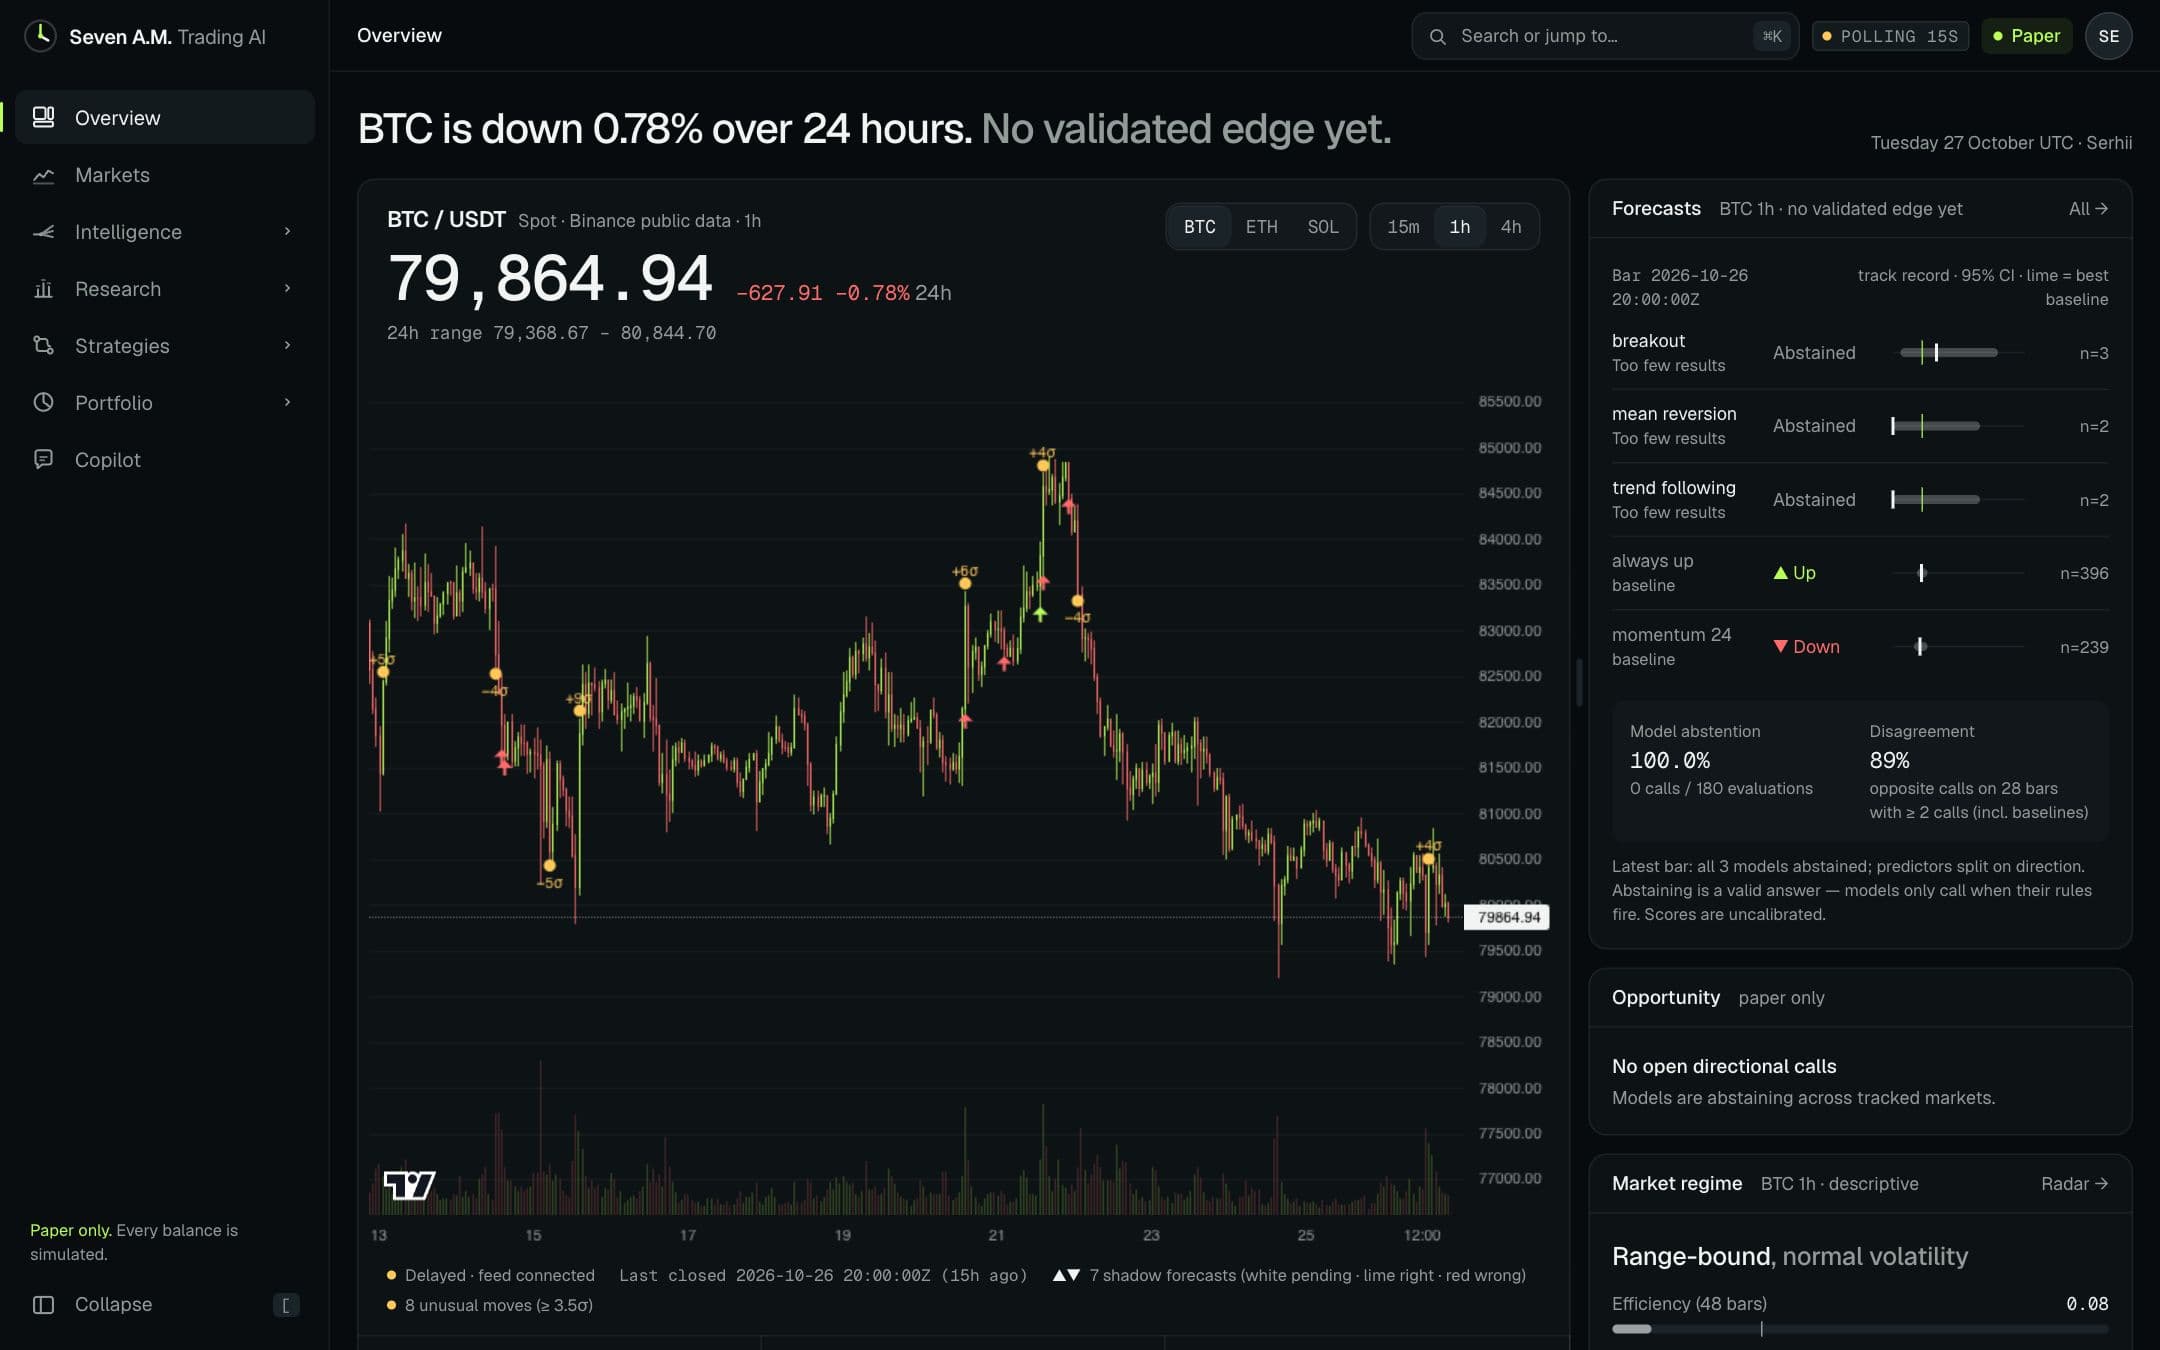
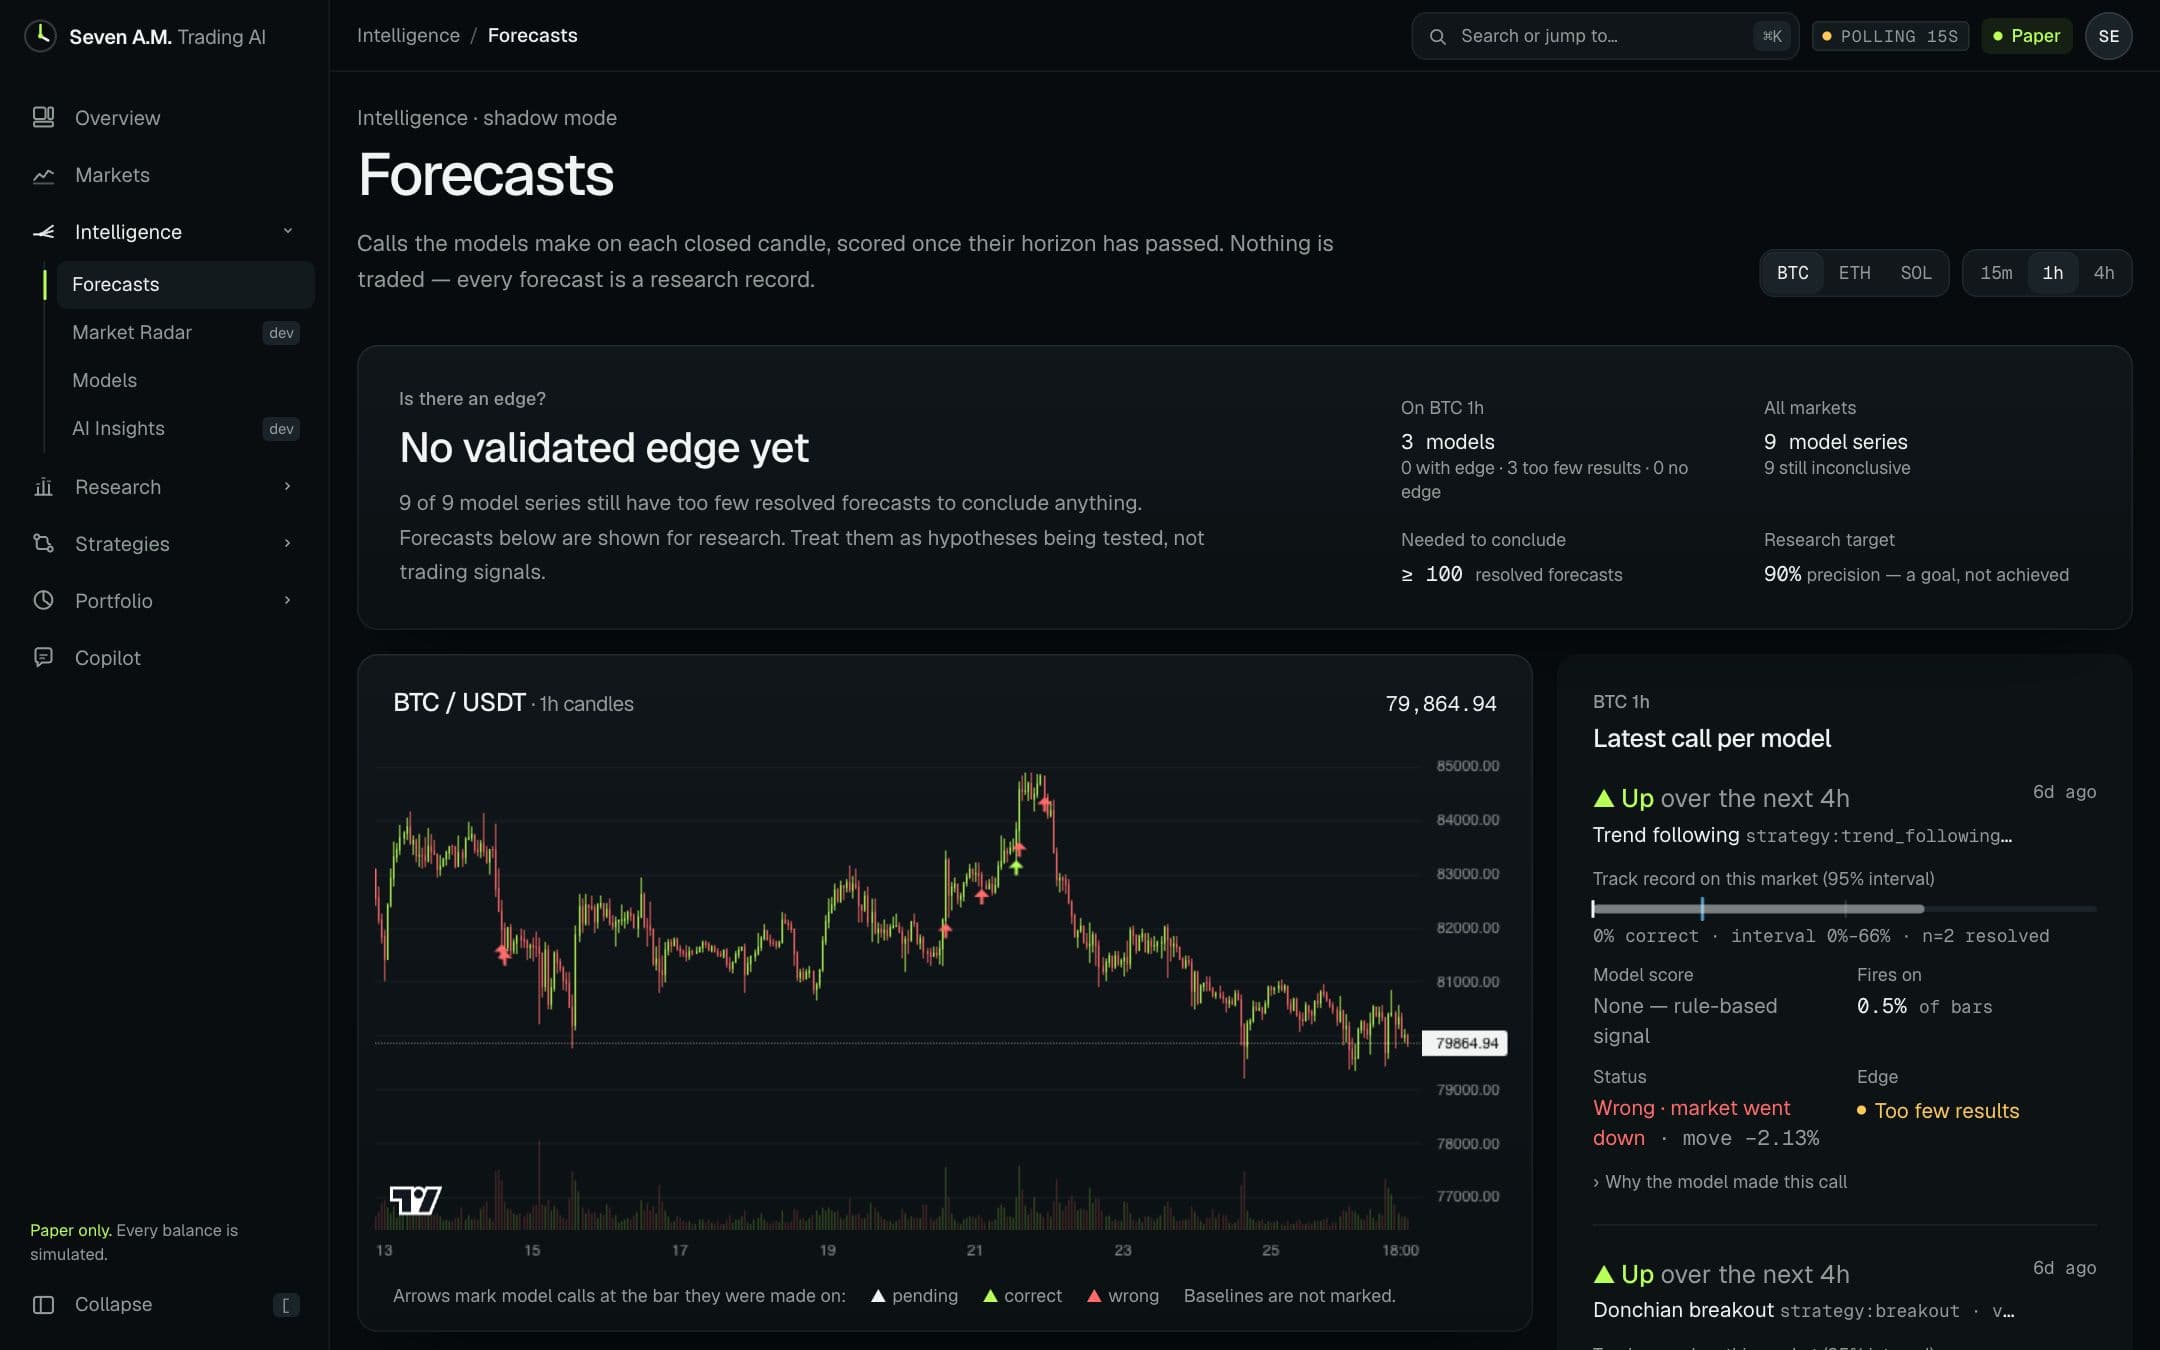
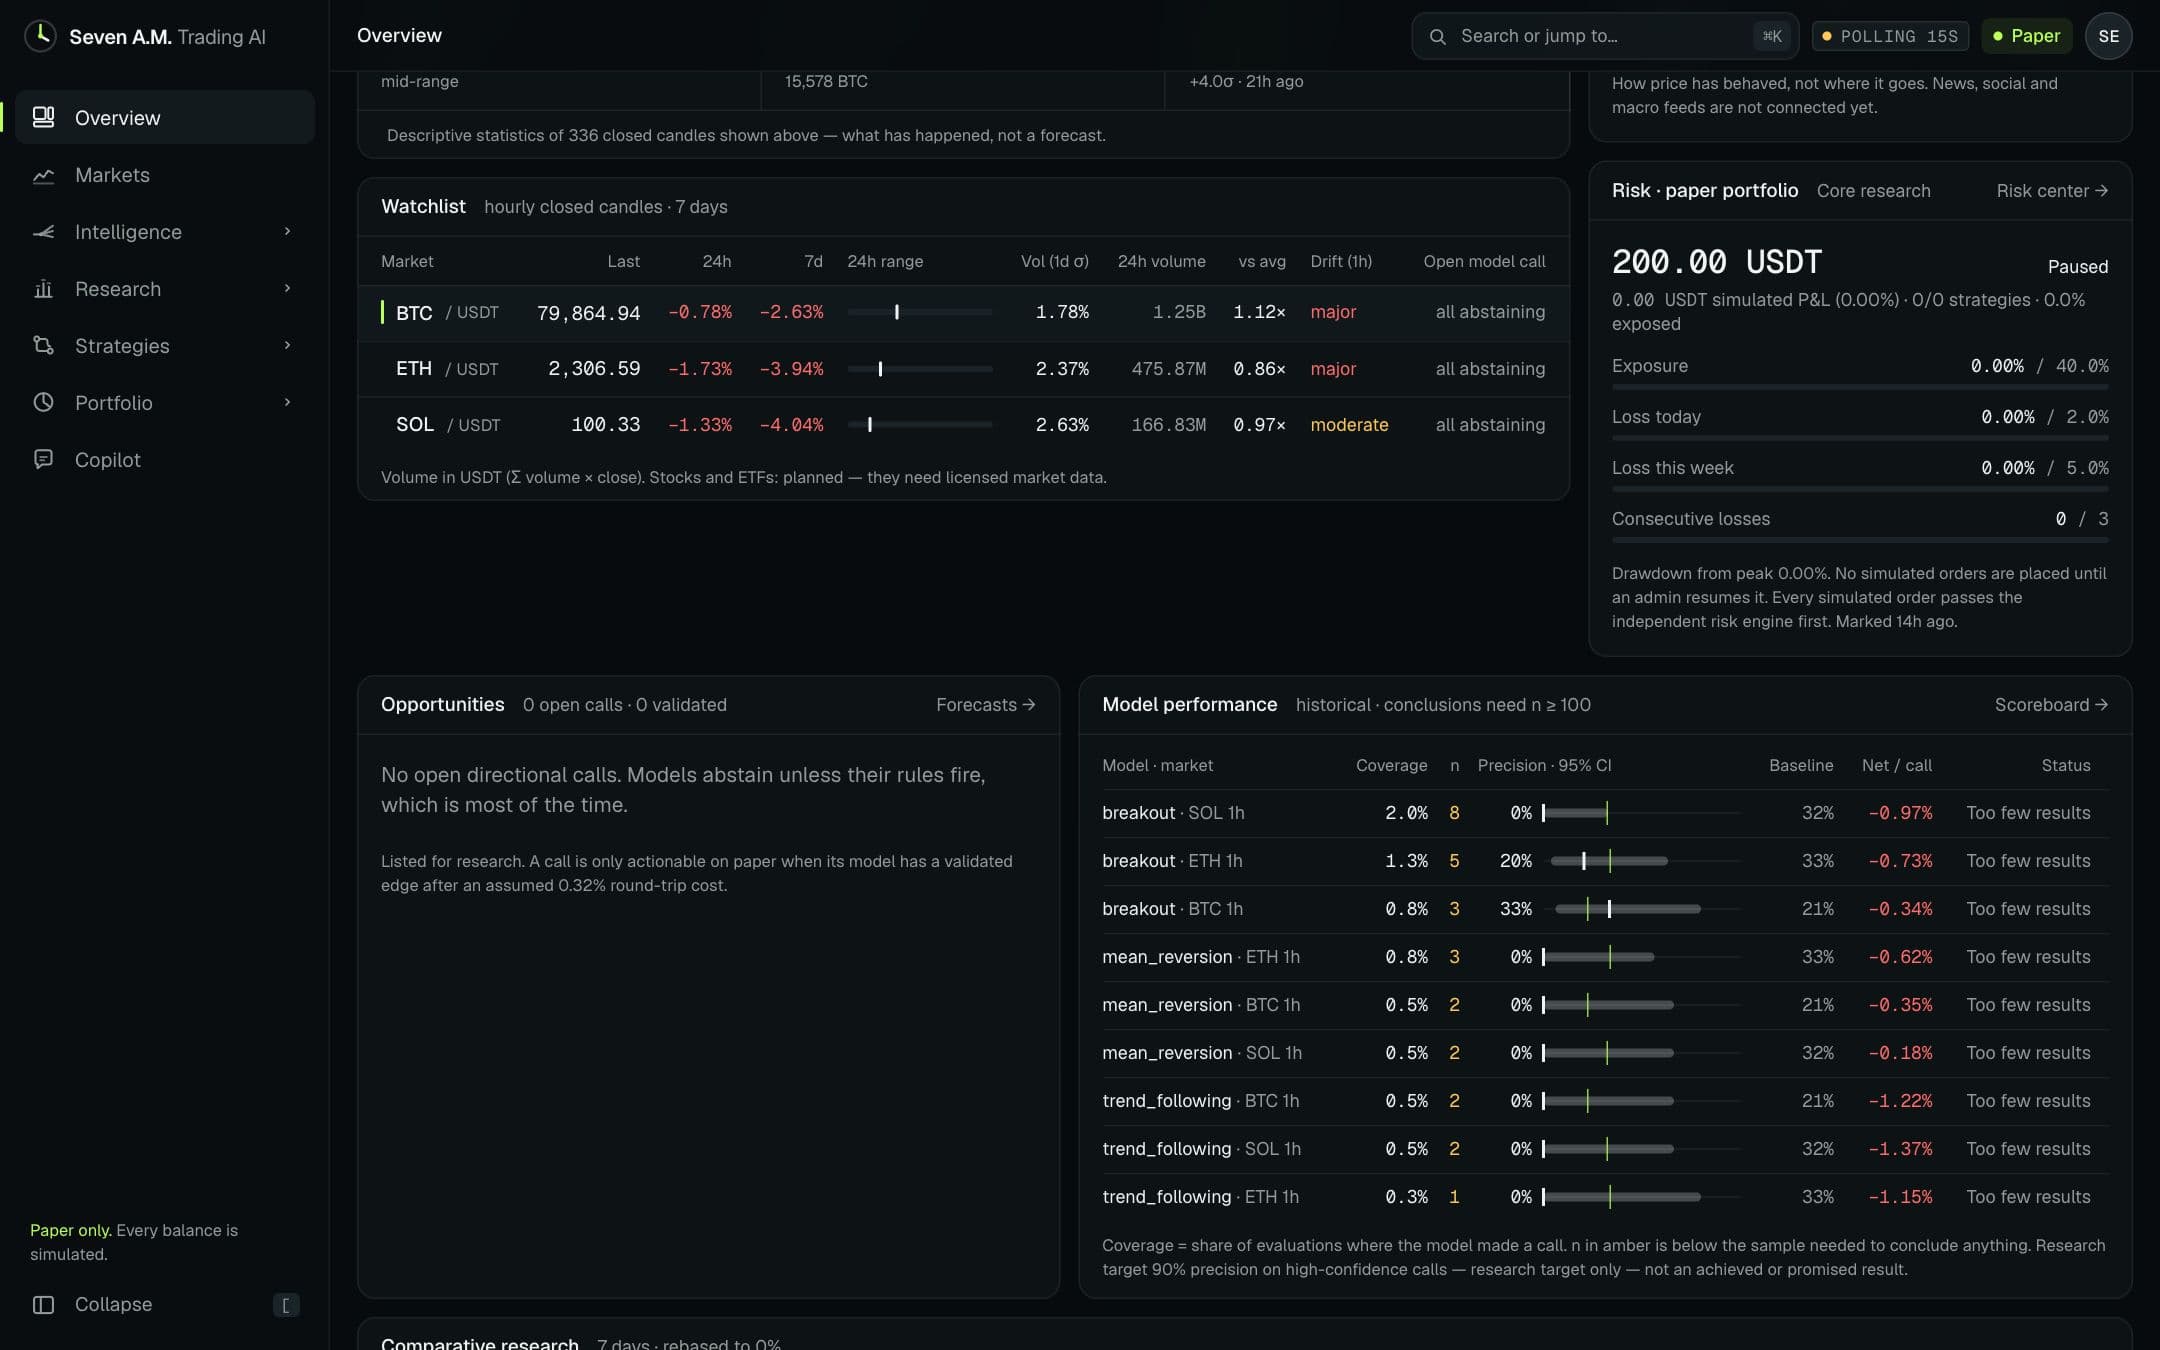
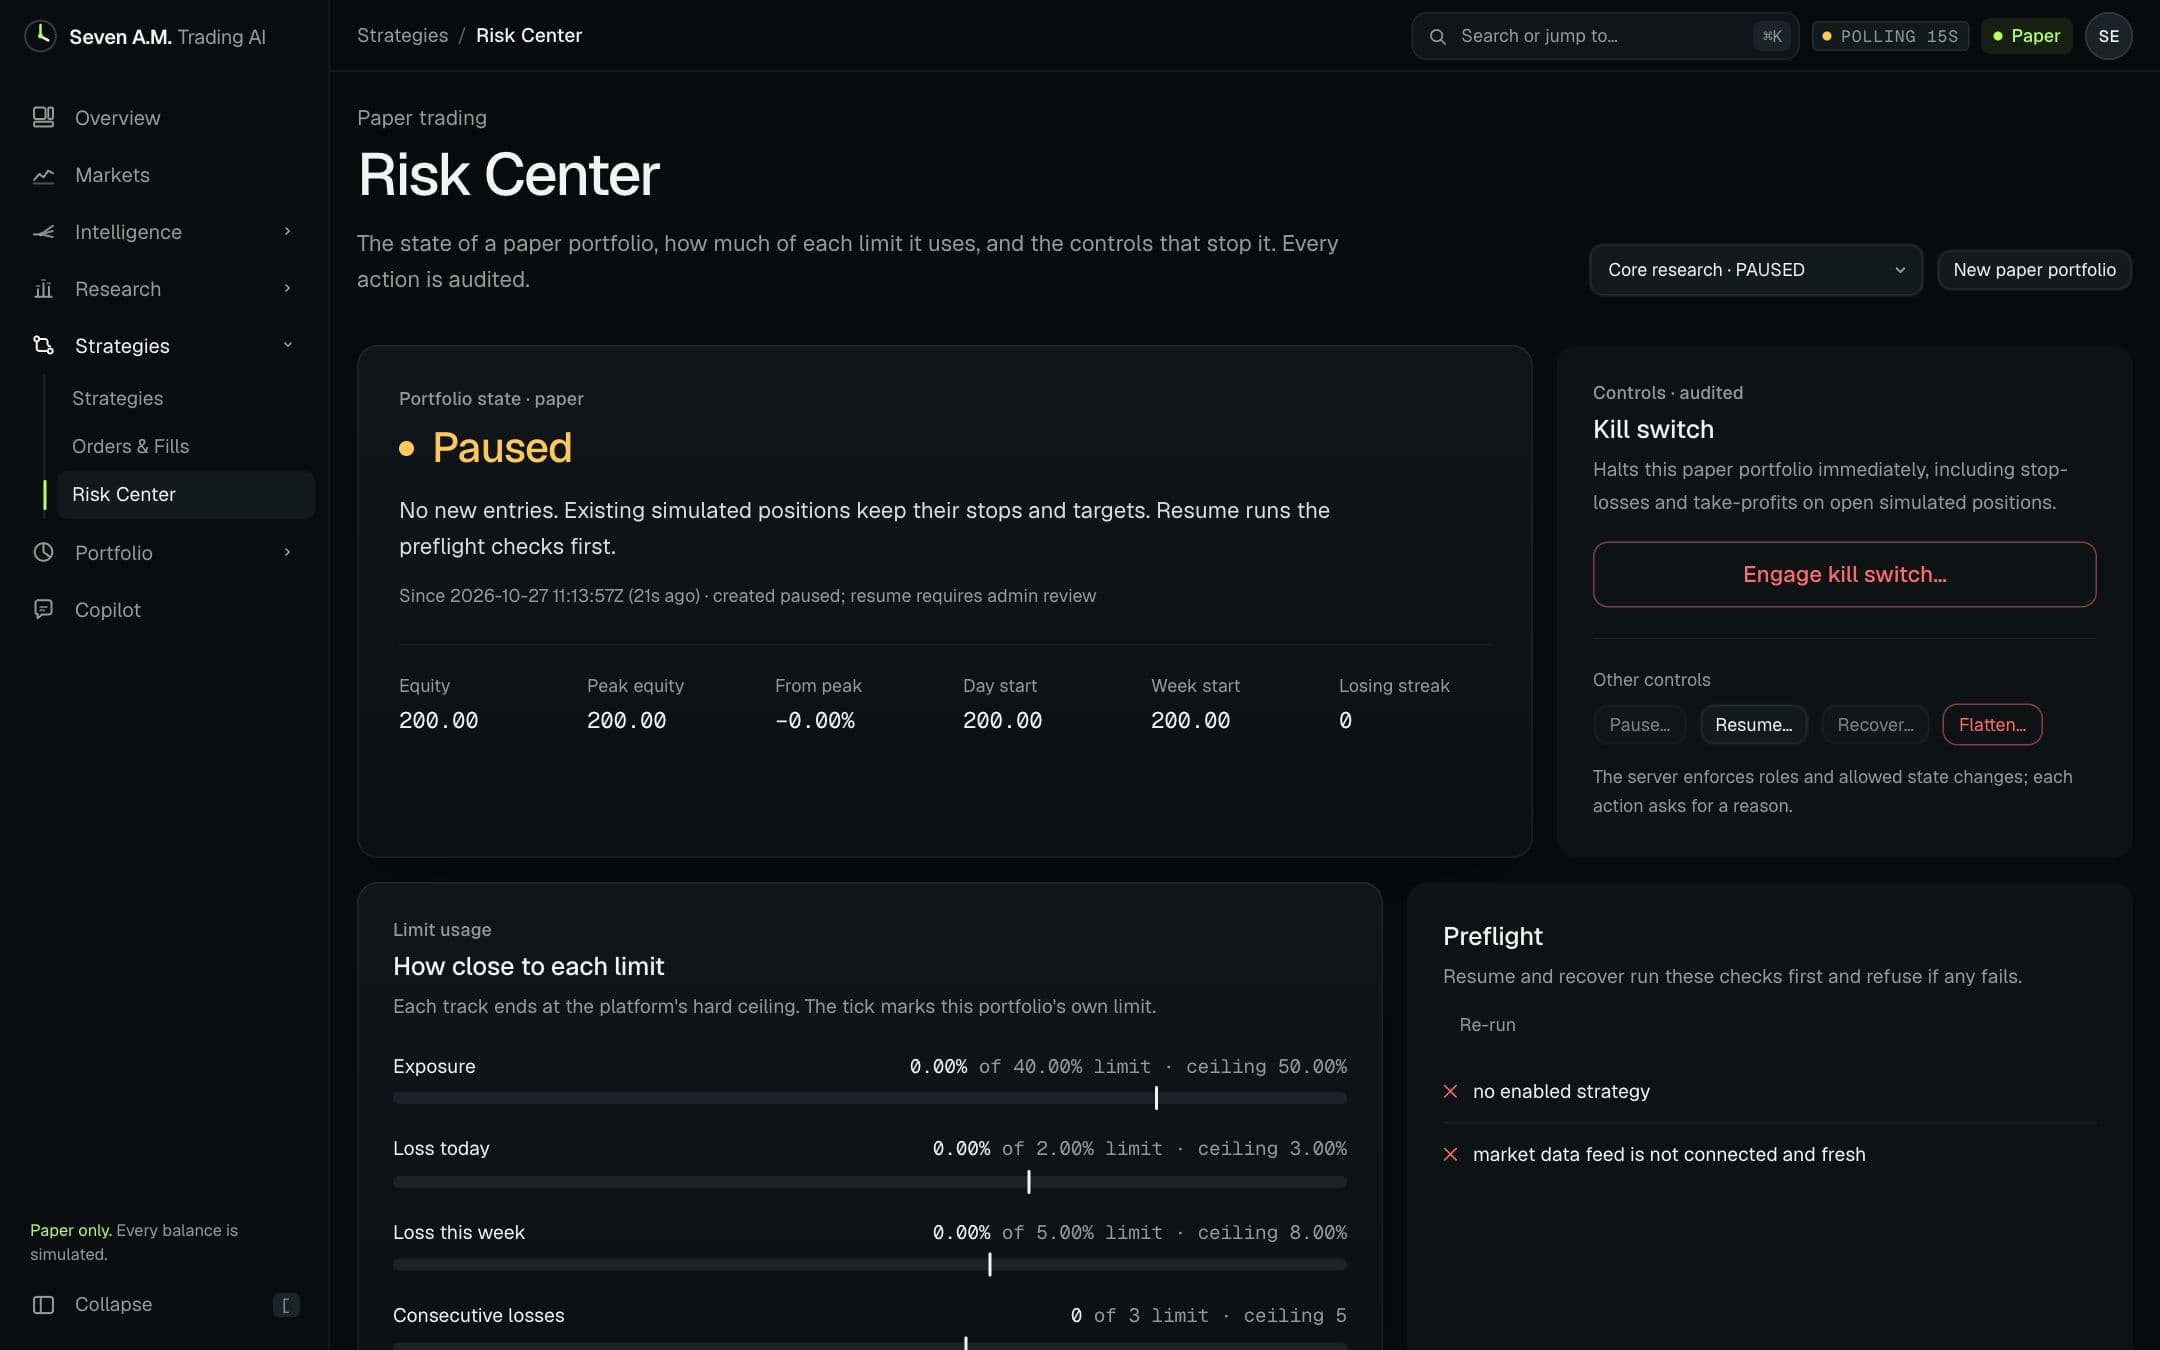
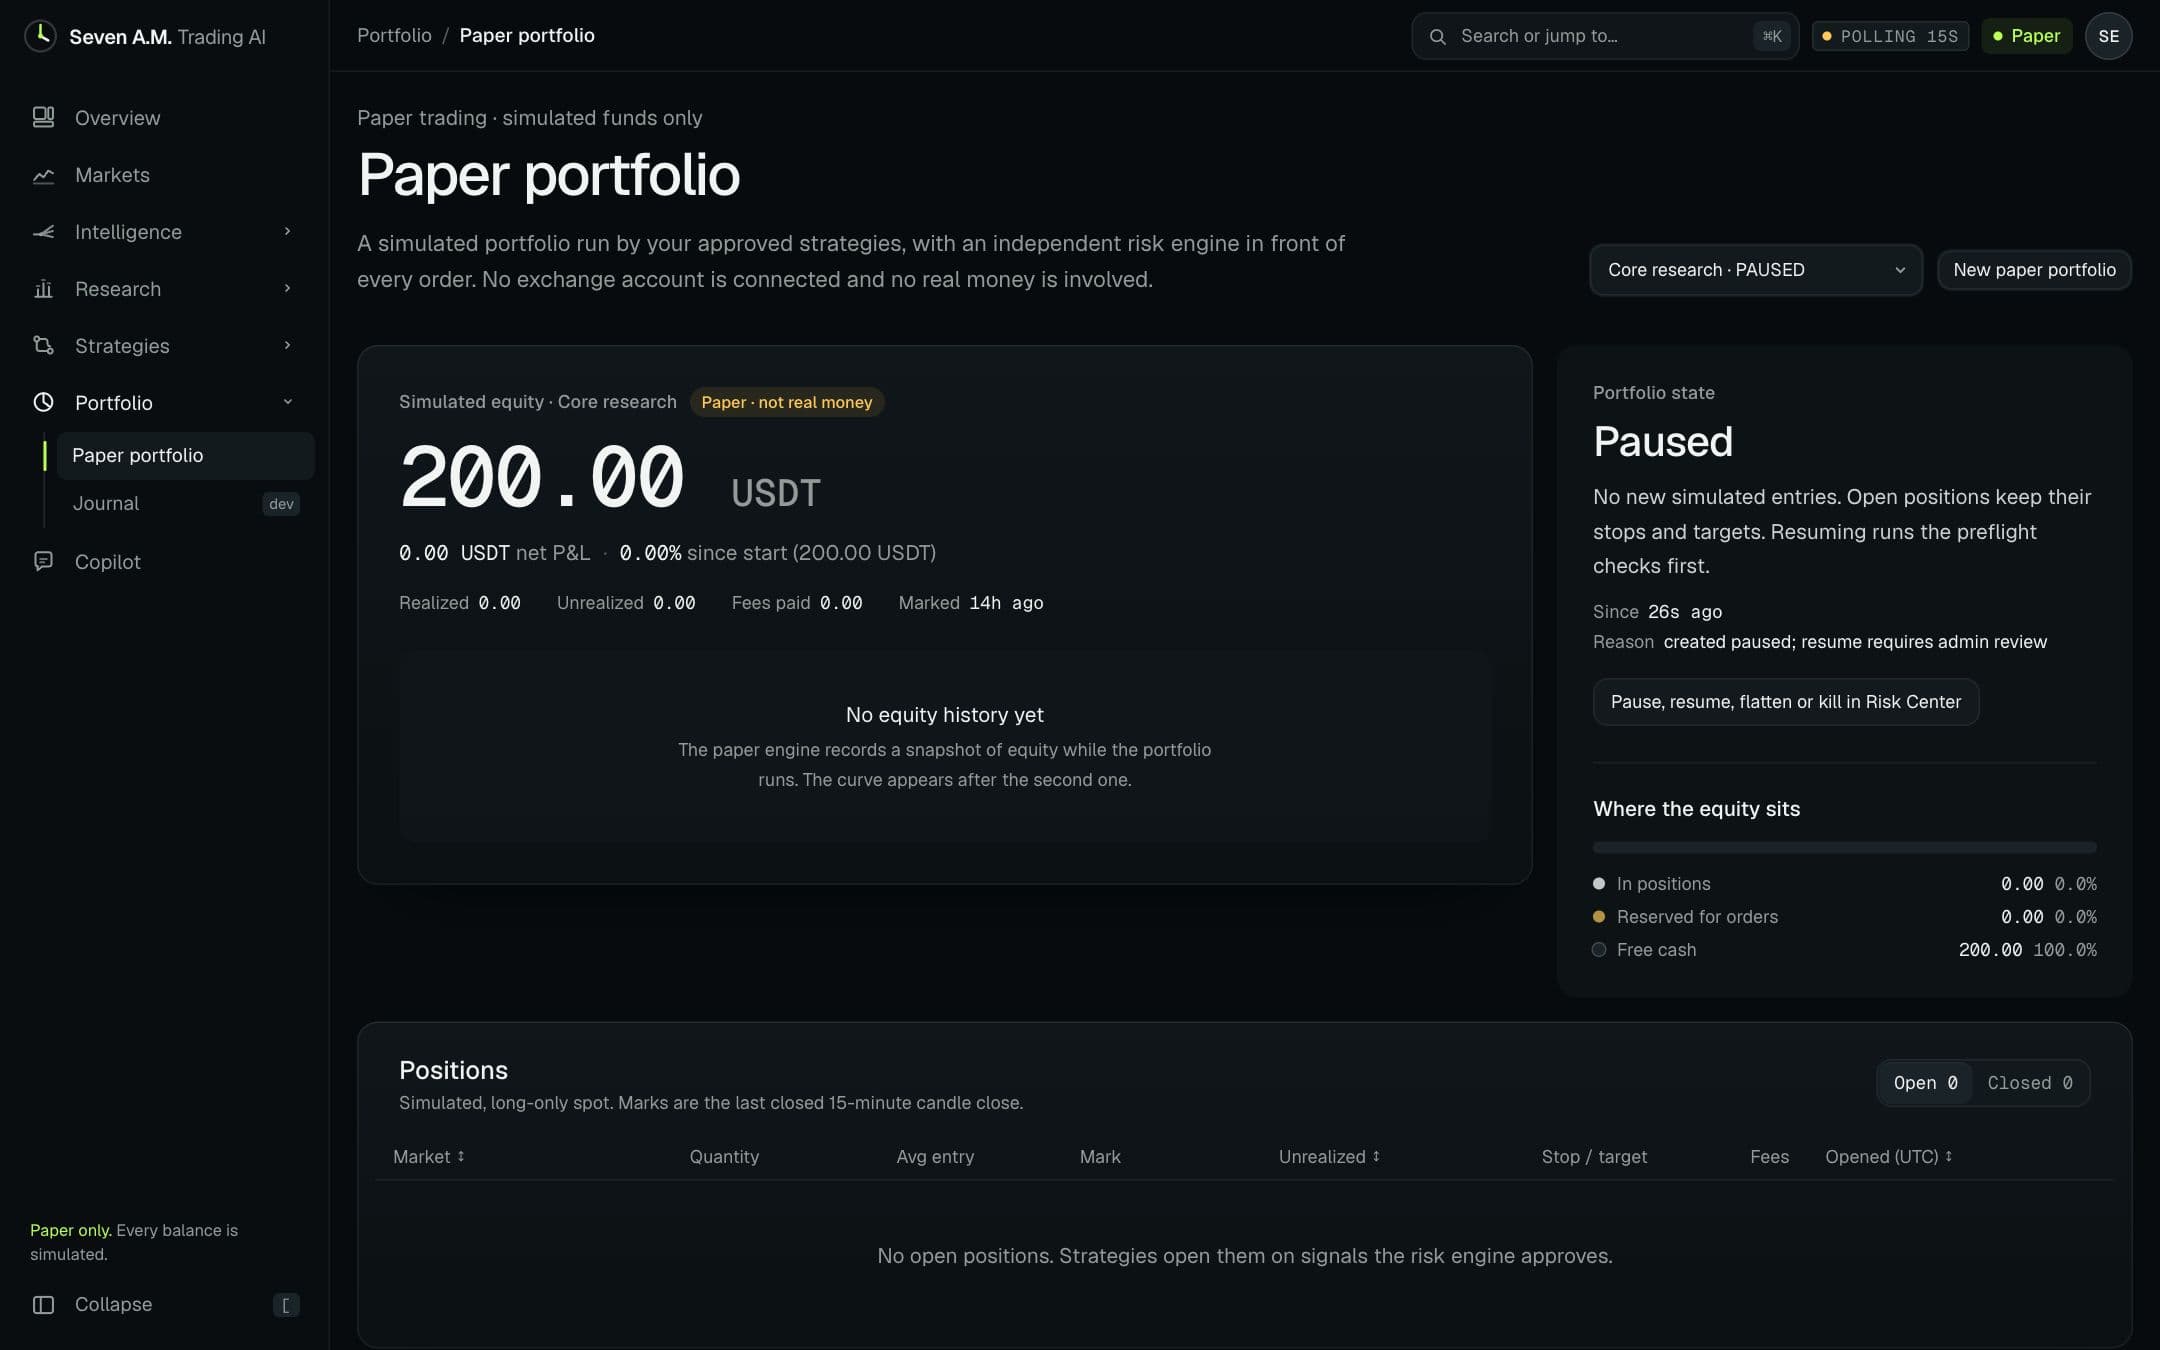
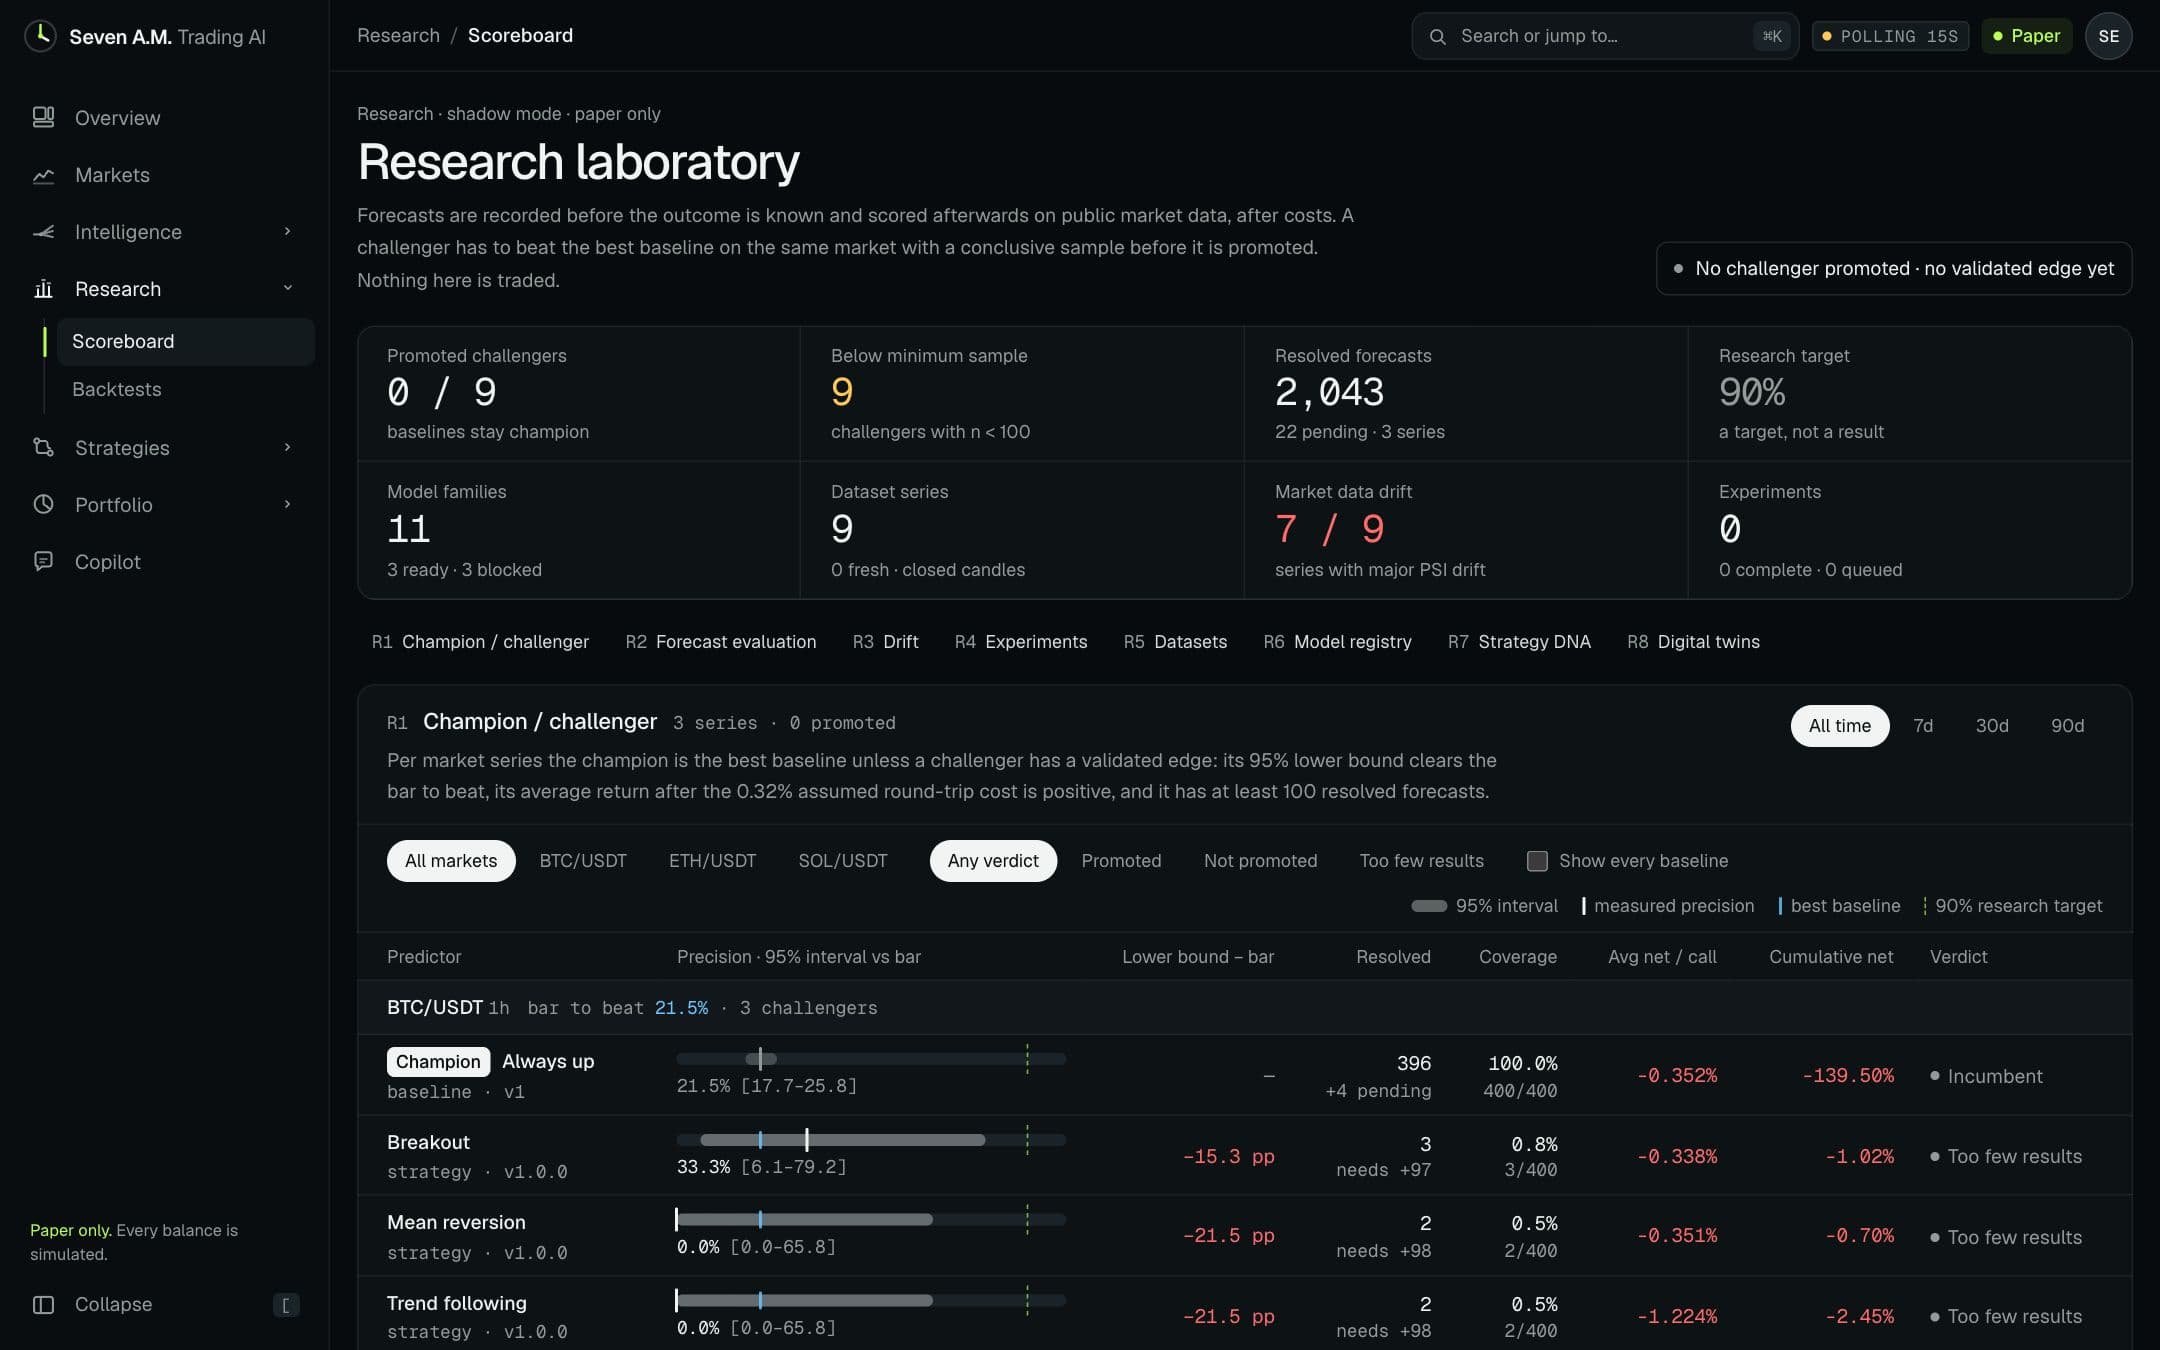
Actual product screens · local build replaying real historical market data · 27 Oct 2026 · paper trading
Uncertainty is part of the signal.
The spread of possible BTC moves widens with the square root of time — from today’s 30-day realised volatility (2% a day). A model that ignores this is overconfident; one that reports it is useful. The method, not a forecast.
06Risk is part of intelligence
Default limits · enforced server-side on every paper order
- risk per trade
- 0.5%
- of equity lost if the stop is hit
- max position
- 20%
- of equity in any one position
- total exposure
- 40%
- across every open position
- daily loss lock
- 2%
- no new entries until tomorrow
- losses in a row
- 3
- and the system pauses
- volatility ceiling
- 8%
- ATR as a share of price
- stop distance
- 0.5–15%
- every entry needs a stop
Uncertainty
2–23%
The 95% interval on the replay's hit rate (2 of 28). An interval that wide is not conviction, so size never grows with a model's confidence — only the limits set it.
Strategy rejection
0 of 9
Model × market candidates that passed the research bar. The rest stay in shadow mode: they are scored, never promoted to drive orders on evidence that thin.
Kill switch
Check 01
One switch stops every new entry. It is evaluated before anything else, so no signal, however strong, can talk its way past it.
Propose an order. Watch it decide.
Try a scenario
Risk engine · 7 checks · default limits
01System state
pass
Running. Kill switch is off.
02Loss limits
pass
Down 0% today (limit 2%), 0 losses in a row (pause at 3).
03Data freshness
pass
Latest candle and mark prices are fresh.
04Stop distance
pass
2% below entry — between 0.5% and 15%.
05Volatility
pass
ATR is 1.2% of price — under the 8% ceiling.
06Sizing
pass
The risk budget would allow 50.00 USDT, but one position may use at most 20% of equity.
07Exposure
pass
0% open + 20% new = 20% of a 40% cap.
Approved
40.00 USDT paper position — 20% of equity, 0.80 USDT at risk.
- Sized position
- 40.00 USDT
- At risk at stop
- 0.80 USDT
- Binding cap
- 20% per-position cap
- Costs (0.32%)
- 0.13 USDT
An illustrative, simplified mirror of the engine’s checks with default limits. The server-side engine is the only authority. Paper only.
99%
NO TRADE is a result.
Of 504 strategy evaluations on the last 168 hourly BTC/USDT bars, 499 ended in no call. The baselines call on (nearly) every bar — and are wrong most of the time.
Always upbaseline
168 · 39 right
Momentum 24baseline
109 · 24 right
Breakoutstrategy
3 · 1 right
Mean reversionstrategy
0 · 0 right
Trend followingstrategy
2 · 0 right
What happened
resolved later
07Continuous research
01 / 06 · one research cycle
Closed candles — and later other inputs — are stored with the time they became available, so nothing from the future can leak into the past.
New features and ideas are proposed and recorded before they are tested, so a lucky result cannot be rationalised after the fact.
Candidates are trained on purged walk-forward splits: learn from an earlier stretch, leave a gap so overlapping labels cannot leak, then test on what came next.
Every candidate is measured after fees and slippage and against simple baselines. The most recent period stays locked as a protected test set until the very end.
The challenger and the current champion are scored on the same data, the same costs and the same periods.
A challenger replaces the champion only if it beats it out of sample after costs. Otherwise it is rejected — and the result is logged either way.
Stage 1 of 6: Collect. Closed candles — and later other inputs — are stored with the time they became available, so nothing from the future can leak into the past.
How an experiment is judged.
Three gates, in order, on out-of-sample shadow results. A strategy that fails any of them is not promoted. These are the real strategies and the real scoreboard.
Breakout3 markets · 1h
Resolved calls (100+ per market)
failed:16 resolved
Beats baseline
failed:2 of 16 right
Avg per call after costs
failed:−0.78%
Not promoted
Mean reversion3 markets · 1h
Resolved calls (100+ per market)
failed:7 resolved
Beats baseline
failed:0 of 7 right
Avg per call after costs
failed:−0.42%
Not promoted
Trend following3 markets · 1h
Resolved calls (100+ per market)
failed:5 resolved
Beats baseline
failed:0 of 5 right
Avg per call after costs
failed:−1.27%
Not promoted
Costs: 0.32% round trip (fees, slippage, spread). Baseline: the stronger of “always up” and 24-hour momentum in each market. local shadow replay, last 400 hourly bars per market.
Champion and challenger.
- Champion
- None yet
- No strategy has earned it. Baselines remain the bar.
- Challengers in shadow
- 3
- Breakout · Mean reversion · Trend following
- AA challenger — retrained or new — is scored against the champion on the same data, costs and periods.
- BIt replaces the champion only if it wins out of sample. Otherwise it is rejected and logged.
Purged walk-forward validation
time →
Retraining is not a guarantee of better results.
08On iPhone
A native SwiftUI app on the same account, the same ledger and the same risk engine — not a web wrapper. It is in internal testing only: not on the App Store and not open on TestFlight.
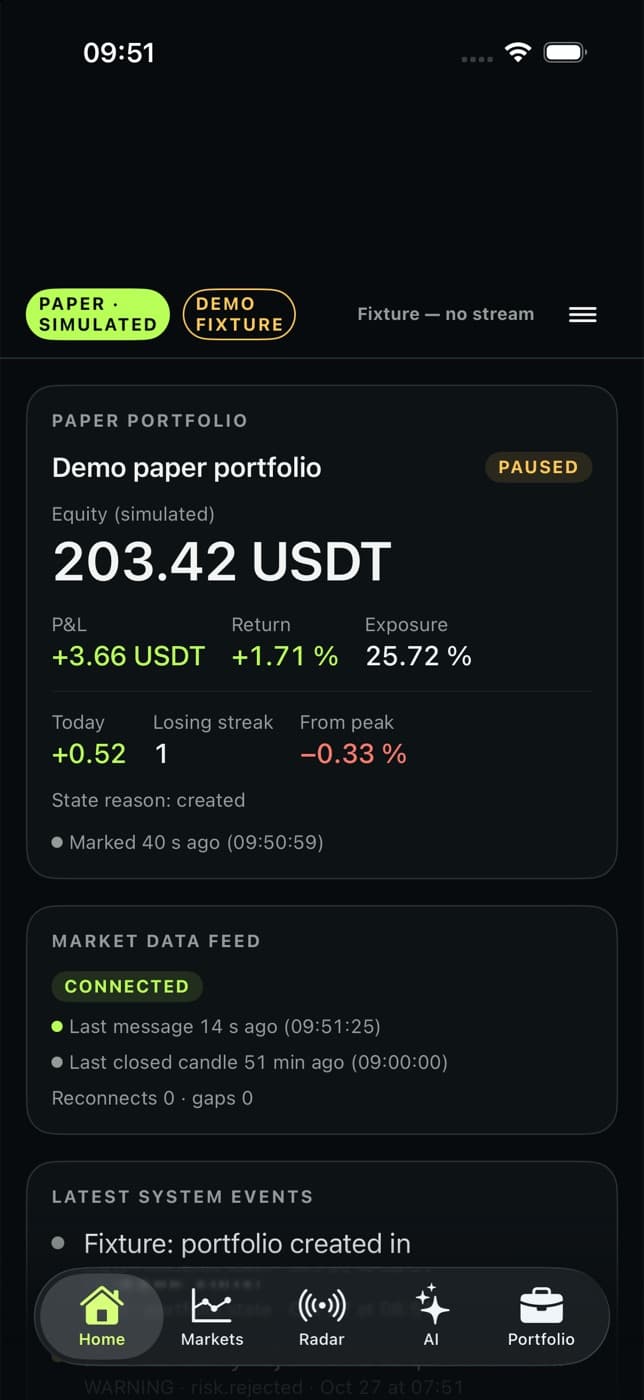 01Home
Simulated equity, P&L and the state of your paper portfolio at a glance.
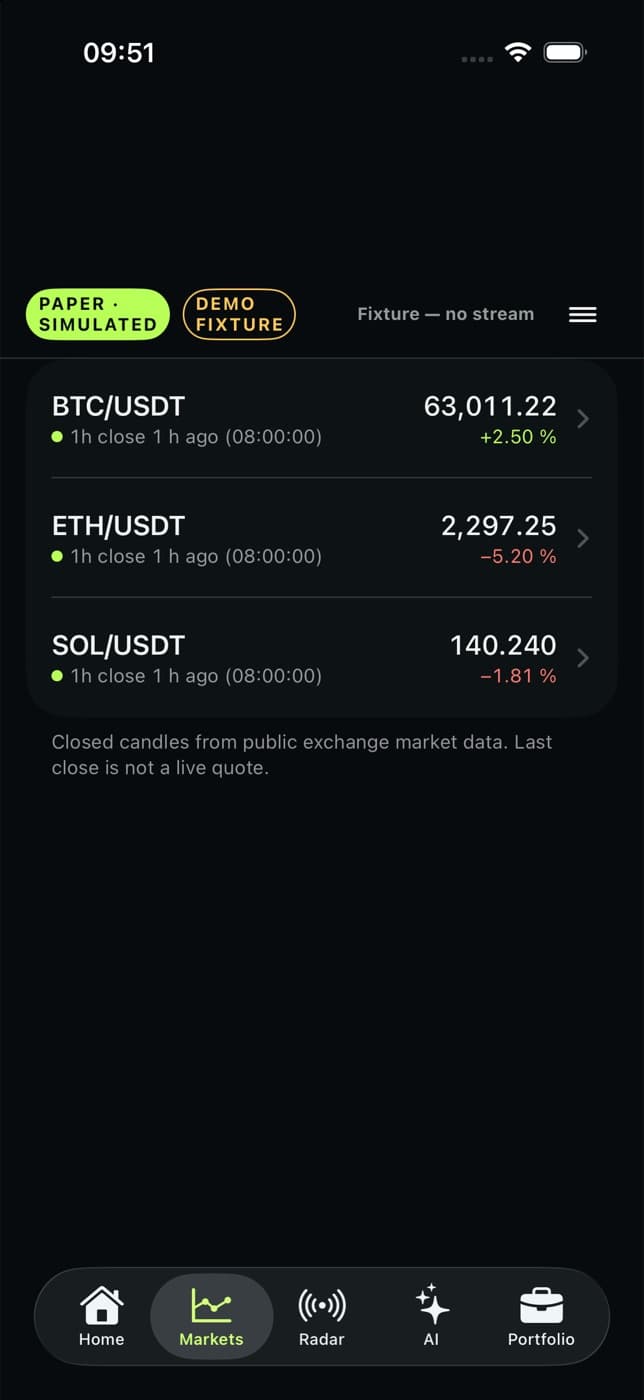 02Markets
Closed candles from public market data — never presented as a live quote.
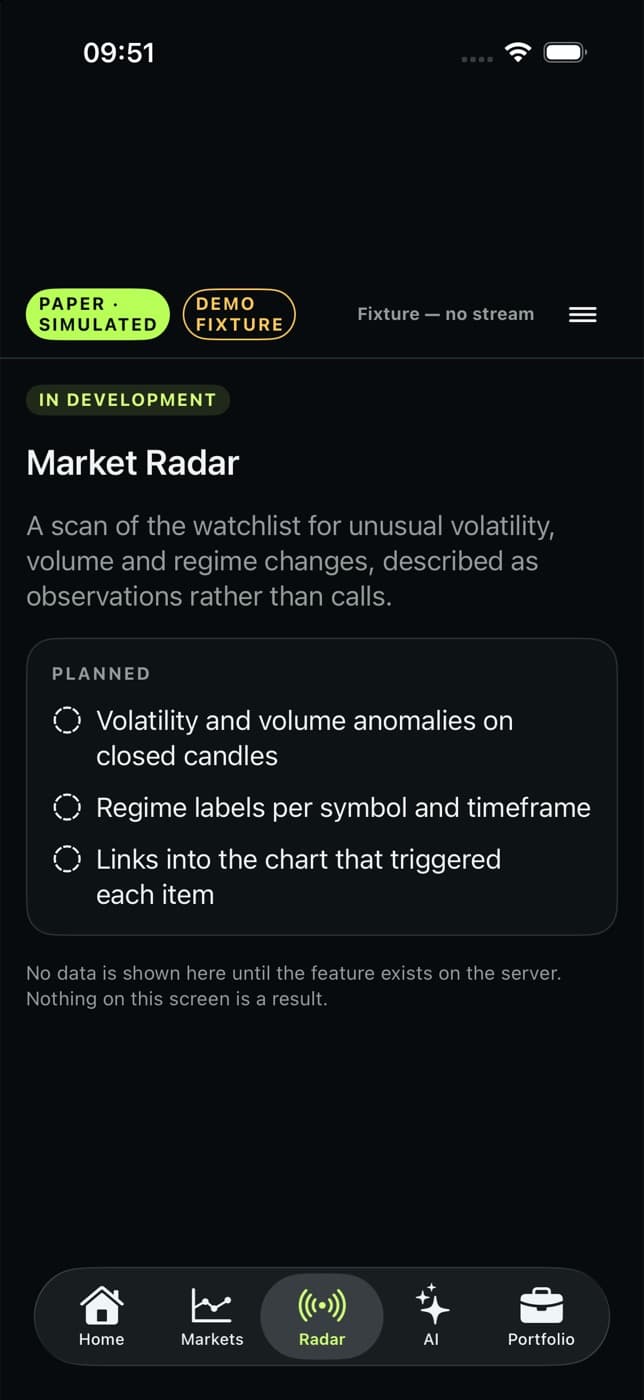 03Radar
Unusual moves and system events, as they are recorded.
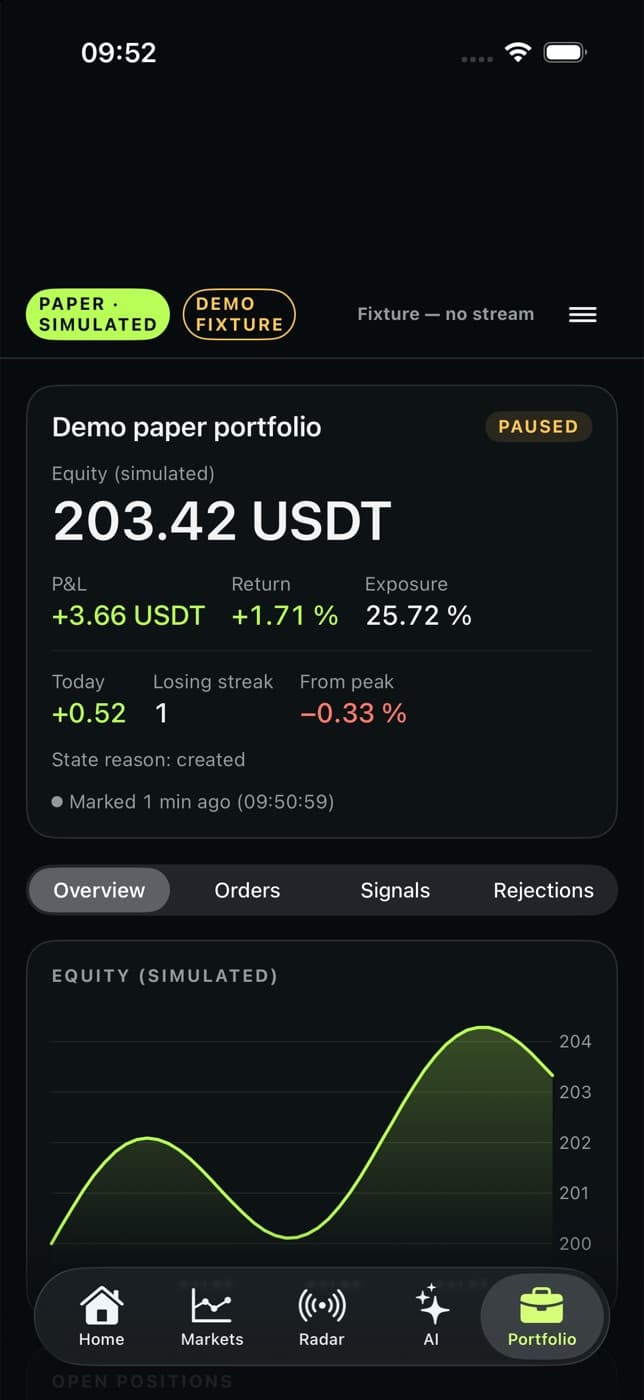 04Portfolio
Positions, orders and fills from the same ledger as the web terminal.
Actual SwiftUI screens · iOS simulator · in-app demo fixture data, labelled in the app · internal testing only
Swipe to see all four screens.
—Status
In the private beta today
Crypto · BTC, ETH, SOL · paper only
- 01
Market overview
Status: BetaBTC, ETH and SOL: what moved, how unusual it was and how old the data is. Closed Binance public candles, never presented as a live quote.
- 02
Market Radar
Status: BetaStrong moves, unusual volume, volatility shifts, trend changes and range breaks, each event explained: what happened, why it fired, how unusual it is and what it cannot establish.
- 03
Market Analyst
Status: BetaAsk about the market and get an answer from stored data, with sources and data times. Rule-based and read-only: it declines advice, forecasts and orders. Up to 50 questions a month in the beta.
- 04
Risk what-if
Status: BetaWhat would a 10, 20 or 30% fall do to holdings you type in? Concentration, volatility and the worst windows stored in the price history. Measurements, never predictions.
- 05
Paper Trading
Status: BetaAutopilotStatus: BetaManual buy and sell on simulated funds, with fees, slippage and a full ledger, plus a paper autopilot that runs approved strategies on closed candles. Every request passes an independent risk engine.
- 06
Morning Briefing
Status: BetaOpen the workspace and see what changed since your last visit, which risk conditions matter and what to watch next — from verified data, with no direction and no recommendation.
- 07
Watchlists and alerts
Status: BetaSave markets and events from Radar. Alert rules for price closes, volatility, Radar events and paper exposure, delivered in the workspace. Alerts never place orders.
- 08
US company fundamentals
Status: BetaWhat US companies reported to the SEC: revenue, earnings, margins, cash flow and debt, with alerts when a company you follow files. No stock prices.
- 09
Verified performance
Status: BetaEvery forecast is recorded before the outcome and scored in public, each kind of evidence on its own. The current verdict: no validated tradable edge.
Coming — not available yet
In development or waiting on a provider
- 01
Connected accounts
Status: In developmentOne read-only view of holdings across accounts. The foundation is in the product; Freedom24 statement import and Binance read-only keys are not enabled yet.
- 02
Stock prices and ETFs
Status: PlannedCompany fundamentals are in the beta; prices are not. Waiting for a licensed market-data provider. No stock prices are shown until one is in place.
- 03
Market workspace
Status: In developmentA full-screen chart workspace built on TradingView charting, for reading a market in depth. In development.
- 04
Asset requests
Status: In developmentAsk for a market to be covered and follow your request through review. In development.
- 05
Market context
Status: In developmentFunding, sentiment, dominance, options and macro data next to the price. Built, and kept switched off until it passes independent evaluation.
- 06
iOS app
Status: In developmentA native companion app, built and tested internally. Not distributed yet.
09Private beta
We invite researchers and traders who want to see the evidence, not a promise. You get early access and a direct line to the team; we get honest feedback.
- Status
- Private beta. Confirm your email and the invitation follows automatically while today's places last.
- Cost
- Free during the beta, with up to 50 Market Analyst questions a month.
- Mode
- Paper trading only. Balances, orders and results are simulated.
- Access
- Web terminal first. The iPhone app is in internal testing.
Your email, for one reason: to confirm your place and send your invitation. Product updates only if you opt in. No advertising trackers, and you can leave any time. Privacy notice
Request an invitation
Private beta · waitlist open
Paper trading only. Seven A.M. is a research tool — not a broker, exchange, wallet or investment advice. Forecasts can be wrong and past results do not predict future ones. Read the risk disclosure